
A Comparison of Data collected by the mdLiDAR3000DL and the mdLiDAR1000
The team at Microdrones would like to present and compare data collected by the mdLiDAR3000 & mdLiDAR1000. In Germany, the crew recently completed a LiDAR surveying mission of a country road in Oberschelden, close to the Microdrones Office in Siegen as well as the actual Siegen office itself.
The mdLiDAR1000 features a SICK Laser scanner, which scans with a point rate of 19,500 points/s and 3 returns. Point cloud colorization is optionally applicable using the integrated 5 MP Camera. The mdLiDAR300 DL features a Riegl miniVUX DL laser scanner with point rates of 100,000 points/s and 5 returns, resulting in a denser point cloud than the mdLiDAR1000 allows with the same flight parameters. In addition to the laser scanner the mdLiDAR3000DL features a SonyRX1R-II with 42.2 MP, which allows for point cloud colorization and orthomosaic mapping.
The Workflow
Here were the steps taken to provide the colorized LAS files corresponding to the flights done with the mdLiDAR1000 and mdLiDAR3000DL after processing using Microdrones software.
- Precision enhancement (Denoising and outlier rejection) to improve precision and remove outliers
- Strip adjustment to improve the relative consistency between lines
- The FORMap bundle adjustment to improve EO file quality
- Point cloud direct colorization (without the need to process an orthophoto priorly as it is done at present using pix4d and global mapper)
This is the standard Microdrones workflow that was applied without the need of any 3rd party software.
The Siegen Microdrones Office

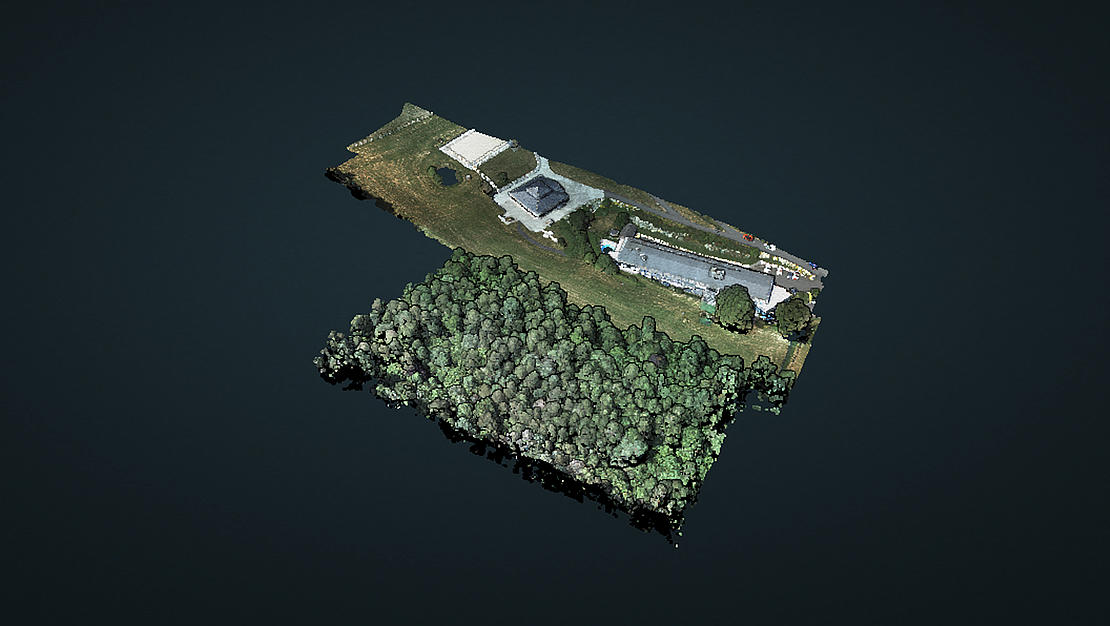
mdLiDAR1000:
This pointcloud displays the Microdrones Siegen office as well as some of the surrounding vegetation. The Data was collected from 2 separate missions that were combined in post processing. The first flight occurred over the Microdrones Siegen, Germany Office and was collected by the mdLiDAR1000 flying at an altitude of 60 meters at a speed of 4 meters per second. The duration of the flight was 8 minutes completed in 2 legs with 60% overlap. The point density was 100 points/m².
The second flight flew over the dense vegetation to the south of the office and was also collected by the mdLiDAR1000 flying at an altitude of 60 meters at a speed of 4 meters per second. The duration of the flight was 9 minutes completed in 5 legs with 60% overlap. The point density was 330 points/m².
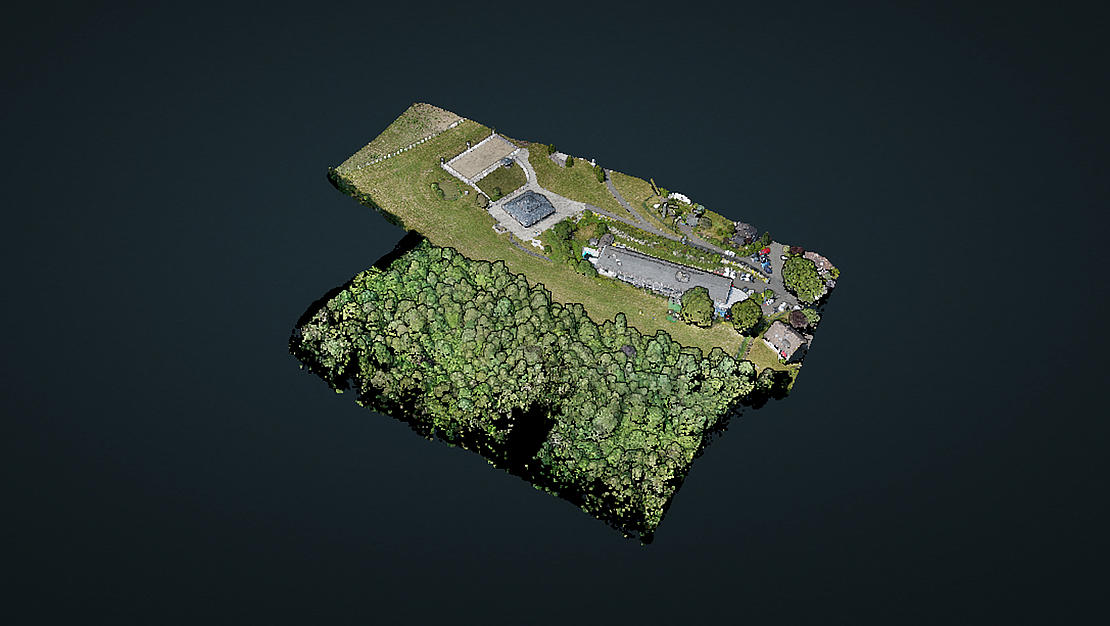
mdLiDAR3000DL:
This pointcloud also displays the Microdrones Siegen office and vegetation as collected from 2 separate missions that were combined in post processing. The first portion was flown over the Microdrones Siegen, Germany Office and collected by the mdLiDAR3000DL flying at an altitude of 60 meters at a speed of 4 meters per second. The duration of the flight was 11 minutes completed in 3 legs with 60% overlap. The point density was 1,120 points/m².
The second flight flew over the dense vegetation to the south of the office and was also collected by the mdLiDAR3000DL flying at an altitude of 60 meters at a speed of 4 meters per second. The duration of the flight was 10 minutes completed in 6 legs with 60% overlap. The point density was 1,570 points/m².
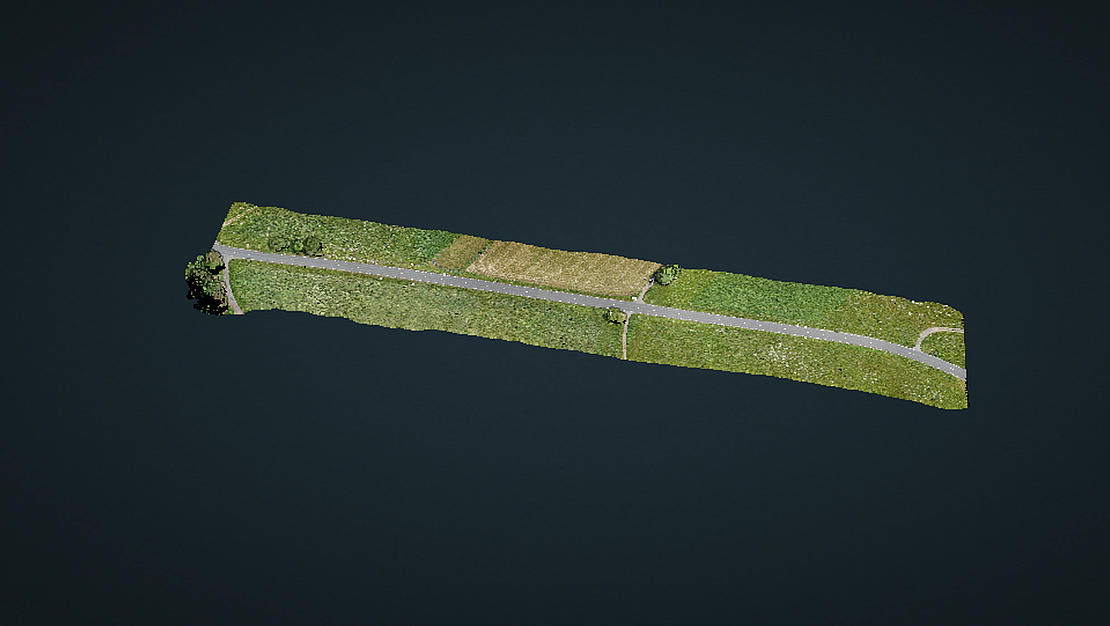
Country Road
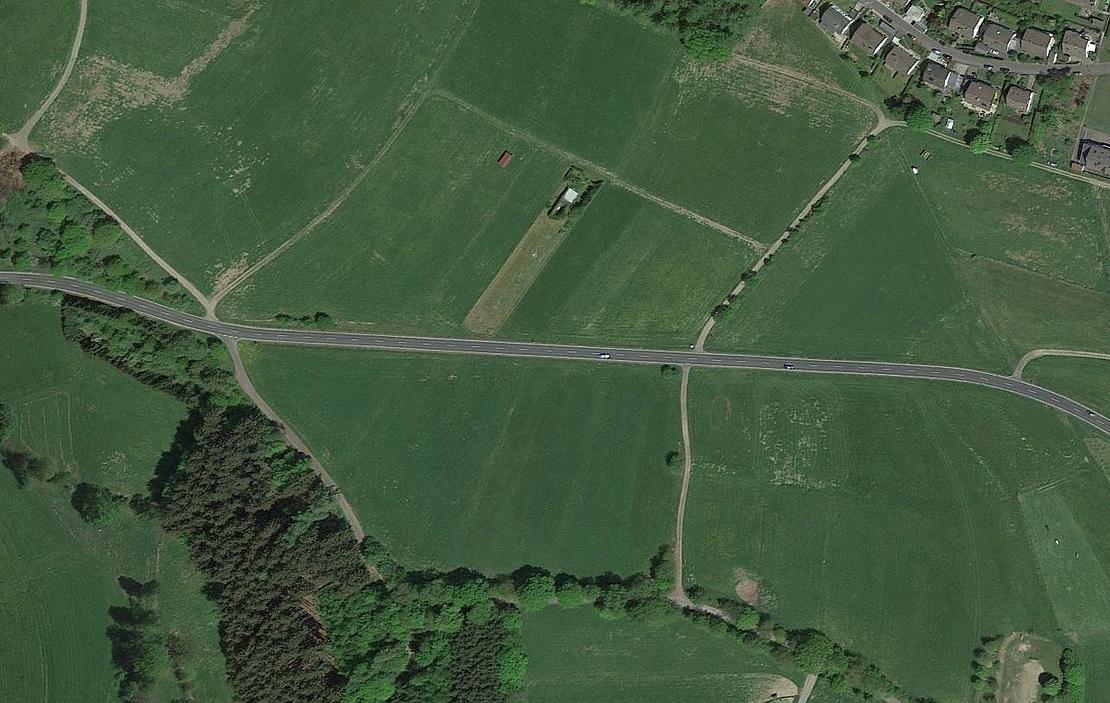
These flights took place at a country road in Oberschelden, close to the Microdrones Office in Siegen. There were some cars on the road at the time of survey. The processing team removed them and removed the images containing the cars in order to get a clean car (otherwise the road is colorized at the car location with the car's color)
mdLiDAR1000:
The pointcloud displayed in the Street Data was collected by the mdLiDAR1000 flying at an altitude of 50 meters at a speed of 4 meters per second. The duration of the flight was 13 minutes completed in 4 legs with 60% overlap. The point density was 120 points/m².
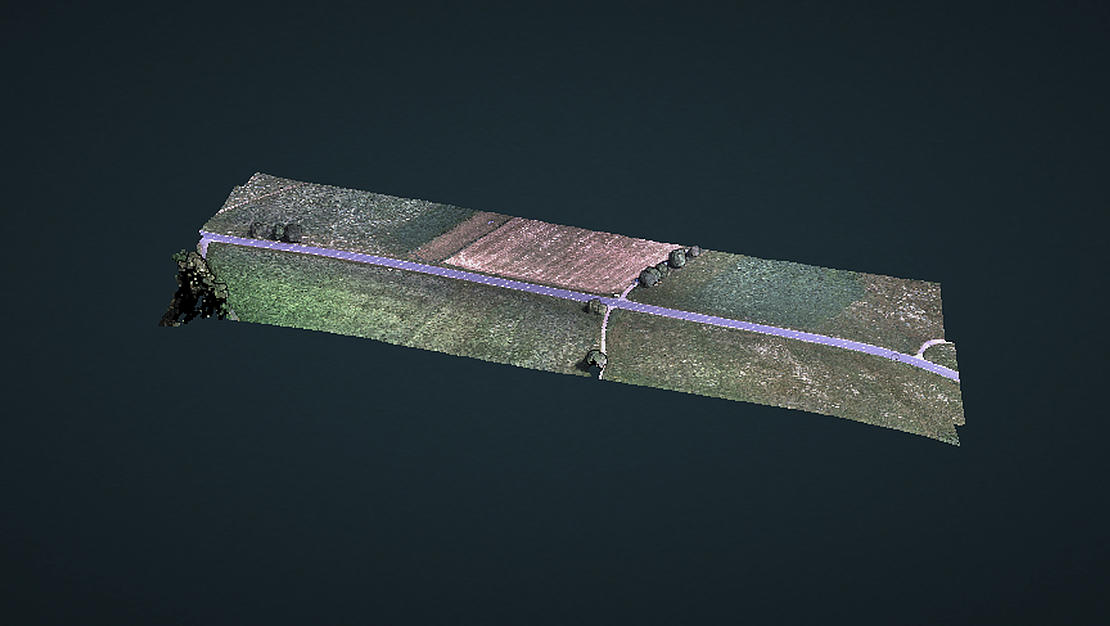
mdLiDAR3000DL:
The pointcloud displayed in the Street Data was collected by the mdLiDAR3000DL flying at an altitude of 50 meters at a speed of 4 meters per second. The duration of the flight was 10 minutes completed in 2 legs with 60% overlap. The point density was 690 points/m².
If you or your business would like to learn more about processing and visualizing Drone LiDAR Data sets for your surveying jobs, CLICK HERE to speak with one of our representatives.